Blog

  • vmware

    Start, Stop, Restart, Console (SSRC)

    A script with useful functions to manage VMs in VMWare vCenter

    This script requires the VMware.PowerCLI module to be installed.

    To install the module, run the following command in PowerShell:

    Install-Module -Name VMware.PowerCLI -AllowClobber -Force

    Usage

    You may need to change the execution policy to run the script. To do this you have a few options:

    Change the Execution Policy Temporarily

    You can change the execution policy for the current PowerShell session only, without affecting the system-wide execution policy:

    Set-ExecutionPolicy -Scope Process -ExecutionPolicy Bypass

    Change the Execution Policy Permanently

    You can change the execution policy permanently for all PowerShell sessions. Open a PowerShell window with “Run as Administrator” option and run:

    Set-ExecutionPolicy RemoteSigned

    This will allow running unsigned scripts that you write on your local computer and signed scripts from the Internet. Please note that this changes the policy permanently. If you want to change it back to the default, run:

    Set-ExecutionPolicy Restricted

    Bypass Execution Policy at Run-time

    You can also bypass the execution policy at run-time with this command:

    powershell.exe -ExecutionPolicy Bypass -File "C:\FILE\LOCATION\vm-ssrc.ps1"

    Run the script

    C:\FILE\LOCATION\vm-ssrc.ps1

    Features

    Function Description
    Create VM Creates a VM by entering the name, selecting the host, datastore, network, OS, RAM, CPU, and disk size.
    Start VM Starts a VM selected from a list of VMs by number.
    Stop VM Stops a VM selected from a list of VMs by number.
    Restart VM Restarts a VM selected from a list of VMs by number.
    Open VM Console Opens the console of a VM selected from a list of VMs by number.
    Get IP Address of VM Gets the IP address of a VM selected from a list of VMs by number.
    Get VM Info Gets the raw VM info of a VM selected from a list of VMs by number.
    VMware Tools Submenu to install, update, or dismount VMware Tools on a VM selected from a list of VMs by number.
    Get VM List Outputs a list of VMs in the vCenter and their power state color coded. Green = Powered On, Red = Powered Off, Yellow = Suspended.
    Delete VM Deletes a VM selected from a list of VMs by number.

    Changelog

    See latest changes here.

    License

    This project is licensed under the Mozilla Public License 2.0 – see the LICENSE file for details.

    Acknowledgments

    Visit original content creator repository
    https://github.com/Harmless05/vmware

  • konturno.github.io

    “Konturno” means “contour” in Esperanto.


    <iframe src=https://konturno.github.io/render-csv-file/ width=100% height=500px >Iframes are not viewable in GitHub source code view</iframe> _Venus de Milo_

    Full Screen: render csv file

    Our motto is “drop us a line.”

    Open one of the links below. When the model appears and starts to rotate click the ‘let’s dance’ button at top right.

    Use 1|2|3 or left|wheel|right fingers to rotate|zoom|pan. Change the ‘line width’ in left menu.

    Click the ‘⌂’ button at lower right to come back here.


    Concept

    2021-10-19

    See new effort “Spirilito” ~ this exact link always goes to latest release

    Read Me: https://konturno.github.io/sandbox/spiralito/readme.html#README.md

    See new effort lines

    2021-01-22

    Kontorno artist collaborative

    • artist following an art director
    • all exhibits accepted
    • exhibits not selected for show or in a salon des refuses
    • source code for the works are kept in a repository
    • artists select an art director for 6 months
    • voting for the art director is by active artists

    2020-01-12

    This project started in November 2019 at the behest of my then new friend DougD – AKA DashDotDotDashDotDot.

    The question is: Given the data – XYZ coordinates that form a mesh of triangles, can you generate the XYZ coordinates for the contour line that closely fits the original data.

    It turns ot that there are a number of methods for doing this that are easy to sart with but not easy to end with. As you will see the project has reached a state where the contour lines are good enough for art even if not good enough for the engineer.

    The challenge now is to make interesting things to look at using these techniques. In my mind, I see these as being the art you might display on the large TV screen in your dining area or entry way. Nice things to look at. Things that are friendly, familiar yet different and where beauty and ugliness cone in and out. An important aspect may be that at least some part is figurative. Looking at non-representational images over long periods of time probably becomes less satisfying then looking at things that do represent.


    There is much more to be said about the genre. About the technology. About the art. About the next steps. And much much more

    But now it’s time for bed…

    To do and wish list
    • Design ‘rooms’ for these works
    • Make the light and models move in interesting ways
    • Allow for multiple models
    • Allow models to have interesting materials and textures
    • Allow the models to be animated
    • Play with the physics
    • Use what is happening in the scene to generate music
    • Allow you to to do even more
    Things you can do using this script
    • Click the three bars( ‘hamburger menu icon’ ) to slide the menu in and out
    • Click the GitHub ‘Octocat’ icon to view or edit the source code on GitHub
    • Click on title to reload tee page
    • Press Control-U/Command-Option-U to view the source code
    • Press Control-Shift-J/Command-Option-J to see if the JavaScript console reports any errors
    Links of interest

    DashDotDotDashDotDot

    Change log

    2020-01-12 ~ Theo

    • First commit

    Visit original content creator repository https://github.com/konturno/konturno.github.io
  • Infernity

    Visit original content creator repository
    https://github.com/qndel/Infernity

  • WGS-Absence-Backend

    Backend App for WGS Absence

    Please note that the frontend is on a separate repository. You can find it here.


    Table of Contents


    About

    banner

    This is the backend express server for frontend service of WGS Absence. This project is part of the WGS Absence project.

    Technologies used:

    • Express (Node.js)
    • Prisma (ORM)
    • Auth0 (JWT Authentication and Authorization)
    • Multer (File Upload)
    • Archiver (Zip File Creator)
    • Express Validator (Request Validation)
    • Nodemailer (Email Sender)

    Getting started

    I only tested this project on Windows 7+. I don’t know if it works on other OS.

    1. Clone the repository

    git clone https://github.com/chiqors/wgs-absence-backend.git

    2. Configure the environment

    .env.example is the example of the environment file. Copy it to .env and configure it. ngrok/ngrok.example.yml is the example of the ngrok configuration file. Copy it to ngrok/ngrok_config.yml and configure it.

    3. Download ngrok executable from here and put it in ngrok folder.

    3. Install dependencies

    pnpm install

    4. Do Prisma Migration

    pnpm prisma:prisma:migrate-dev

    5. Generate Prisma Client

    pnpm prisma:generate

    6. Create the morgan log file at logs/morgan.log

    7. Run the project

    pnpm dev

    8. (Optional) Run NGROK for internal testing

    pnpm start:ngrok

    Credits

    • Thanks to Mailgun for providing email service.
    • Thanks to .tech for providing domain name.
    • Thanks to Vercel for providing hosting service for both frontend and backend.
    • Thanks to Twilio for providing SMS service. (Not implemented yet)
    Visit original content creator repository https://github.com/chiqors/WGS-Absence-Backend
  • Stamper

    Stamper

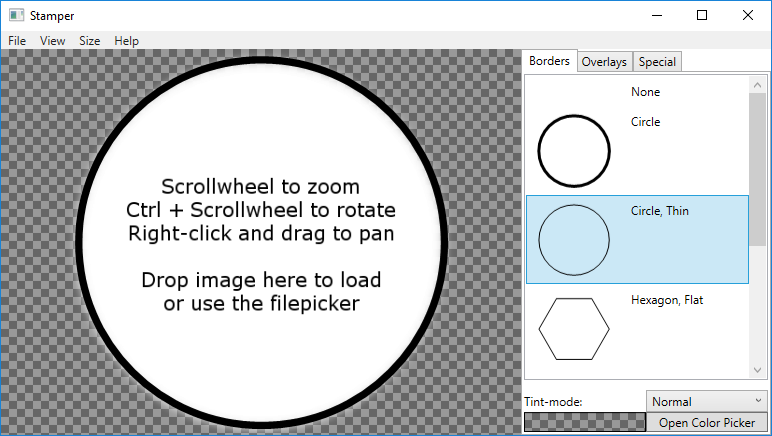
    Stamper provides a way of turning any image into a token for use with tabletop games.

    Stamper supports loading an image from the local filesystem or directly from a website and turning it into a token. The resolution of the final token is customizable, and layer sizes are automatically resized to fit the desired output-resolution.

    Features

    • Drag-and-drop to load images. Load any image from a local file or skip the download by drag-and-dropping from your browser.
    • Border and overlay selection. Stamper comes with simple borders and overlays that can be recolored and layered on top of the loaded image.
    • Custom layers. Adding your own borders and overlays to Stamper is fast and easy. Layers can be SVG or bitmap image files.
    • Direct upload to Imgur. Finished tokens can be saved locally or uploaded directly to Imgur for easy sharing.
    • Custom token sizes. Stamper lets you customize the output size of your token, and scales the layers to fit.
    • Easy image manipulation. Pan-, zoom-, and rotation-functionality is supported through simple mouse-actions.
    • Add text to your token. Stamper lets you place text on top of your token in any position, size, font, rotation, and color.

    Adding custom layers

    Stamper layers can be added automatically through the UI with the option of autogenerating the mask, or by manually placing json files in the layers folder. The structure of the json files is as follows:

    • name: The name of the layer. Required
    • file: A relative path from the layers-folder to the image file. This is the image that is shown on top of the input image in Stamper. Required
    • mask: A relative path from the layers-folder to the image to use as a mask. On border layers, this mask is applied to the underlying input image. On overlay layers, this mask is applied to the overlay itself. Pixels with the color #FF00FF00 (#AARRGGBB) will be removed from the underlying image, all other colors are ignored. Optional
    • type: The layer type. Allowed values are border or overlay. Required

    Example layer

    {
      "name": "Circle",
      "file": "svg\\bCircle.svg",
      "mask": "svg\\bCircle_mask.svg",
      "type": "border"
    }
    

    Installation

    Stamper is Windows-only and requires v4.6.2 or newer of the .NET Framework. You can get the latest release of Stamper here.

    License

    Released under the MIT license.

    Visit original content creator repository https://github.com/Jameak/Stamper
  • D3js-Challenge

    D3 Homework – Data Journalism and D3

    Newsroom

    The challenge

    Welcome to the newsroom! I’ve just accepted a data visualization position for a major metro paper. I am tasked with analyzing the current trends shaping people’s lives, as well as creating charts, graphs, and interactive elements to help readers understand your findings.

    The editor wants to run a series of feature stories about the health risks facing particular demographics. She’s counting on me to sniff out the first story idea by sifting through information from the U.S. Census Bureau and the Behavioral Risk Factor Surveillance System.

    The data set included with the assignment is based on 2014 ACS 1-year estimates: https://factfinder.census.gov/faces/nav/jsf/pages/searchresults.xhtml, The current data set includes data on rates of income, obesity, poverty, etc. by state. MOE stands for “margin of error.”

    Tools for this task

    1. Used D3-Library

    2. html and Javascript

    3. Inside your local git repository

    4. Use the d3-tip.js plugin developed by Justin Palmer—we’ve already included this plugin in your assignment directory.

    My Task

    1. Core Assignment: D3 Dabbler (BASIC STATIC CHART)

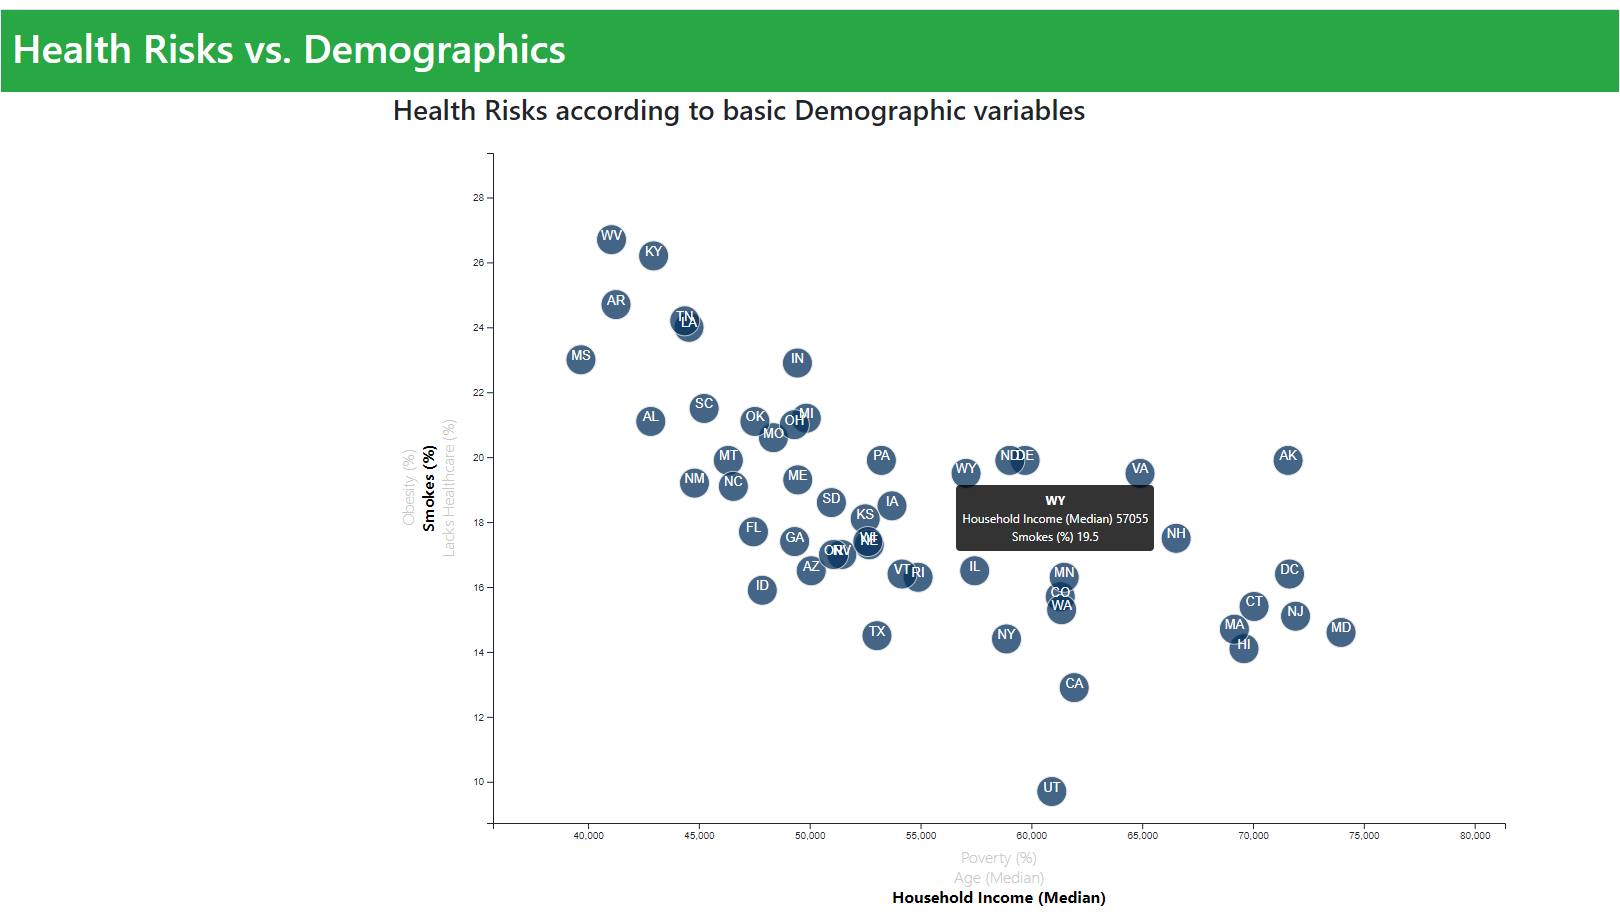
    4-scatter

    CHALLENGE COMPLETED!!

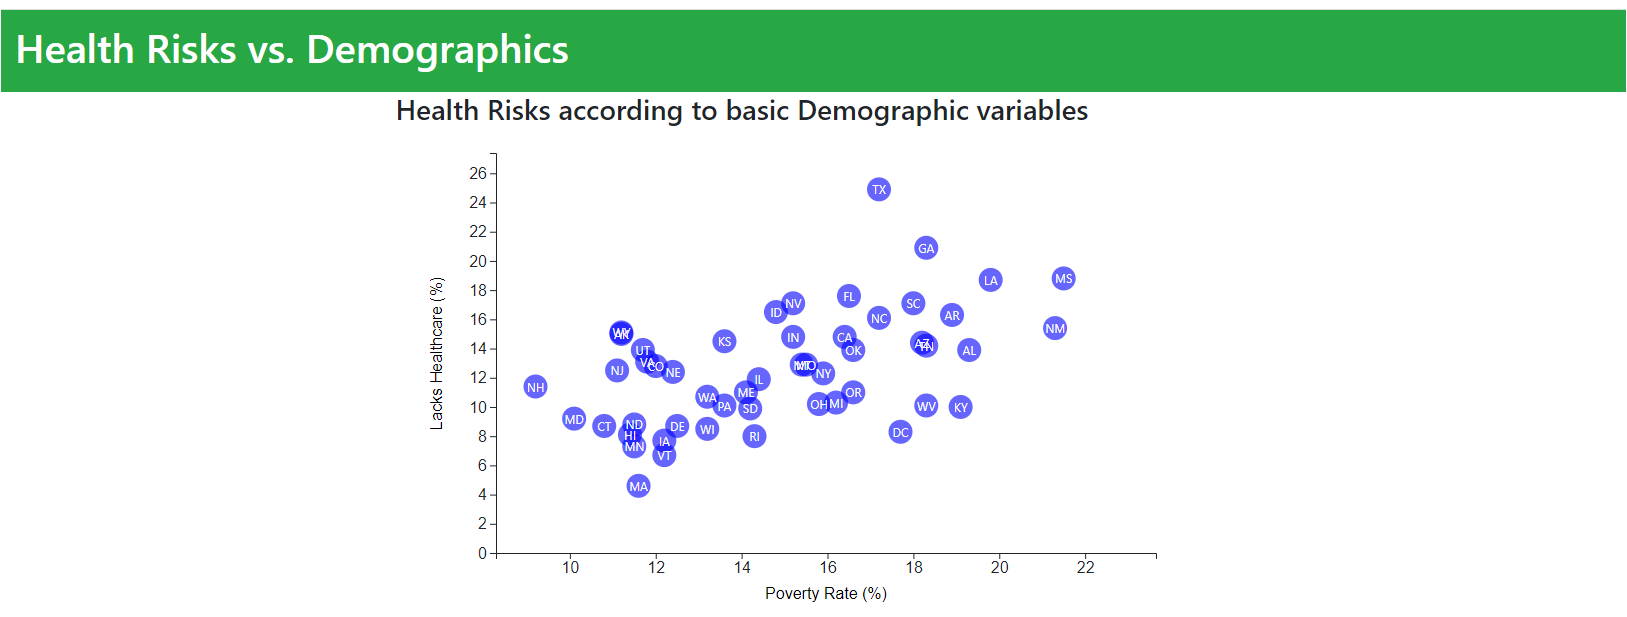
    • You need to create a scatter plot between two of the data variables such as Healthcare vs. Poverty or Smokers vs. Age.

    • Using the D3 techniques create a scatter plot that represents each state with circle elements. I code this graphic in the app.js file, which have the Basic Chart coding. Pull in the data from data.csv by using the d3.csv function.

    • Included state abbreviations in the circles.

    • Create and situate your axes and labels to the left and bottom of the chart.

    • Used python -m http.server to run the visualization. This hosted the page at localhost:8000 in my web browser.

    • Used David Gotz’s example to see how to implement tooltips with d3-tip.


    Bonus: Impressing my Boss!! (UPGRADED CHALLENGE)

    Why making a static graphic when D3 lets you interact with my data?

    7-animated-scatter

    CHALLENGE COMPLETED!!

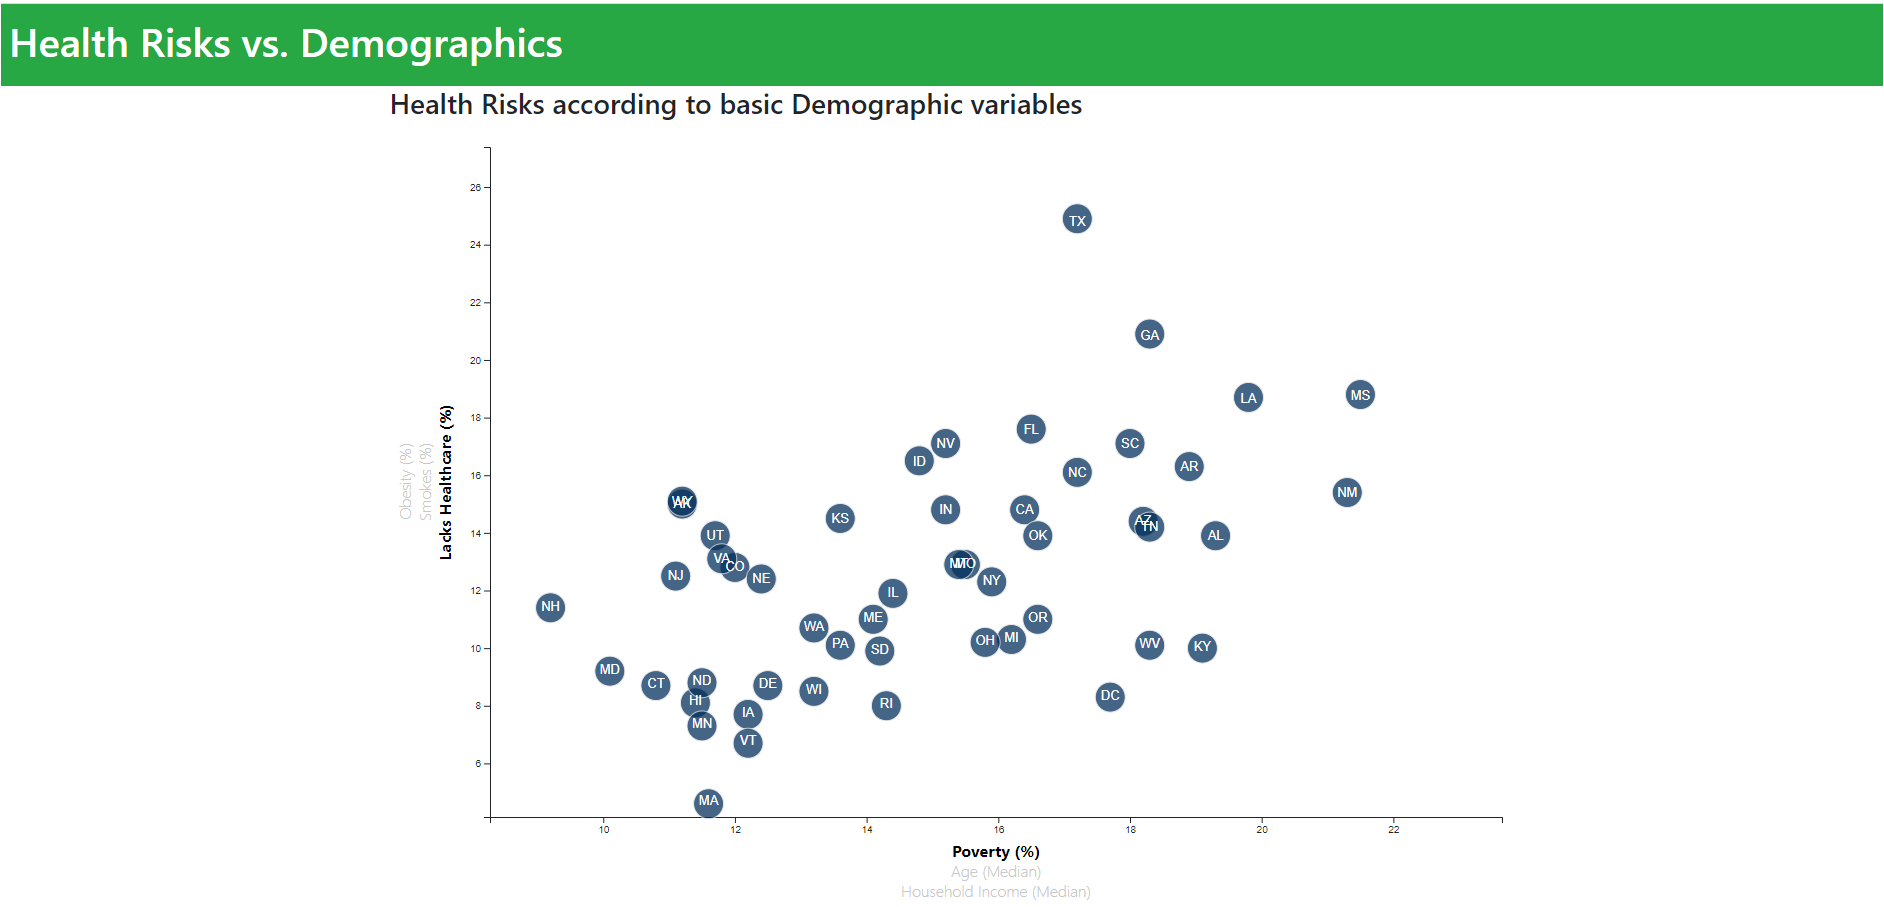
    2. More Data, More Dynamics

    • Included more demographics and more risk factors.
    • Placed additional labels in my scatter plot and give them click events so that your users can decide which data to display. Animated the transitions for your circles’ locations as well as the range of your axes.
    • Complete the extreme challenge and create three for each axis!!!

    7-animated-scatter2

    CHALLENGE COMPLETED!!

    • Binded all of the CSV data to my circles. This determine the x or y values when I click the labels.

    3. Incorporate d3-tip

    7-animated-scatter2

    CHALLENGE COMPLETED!!

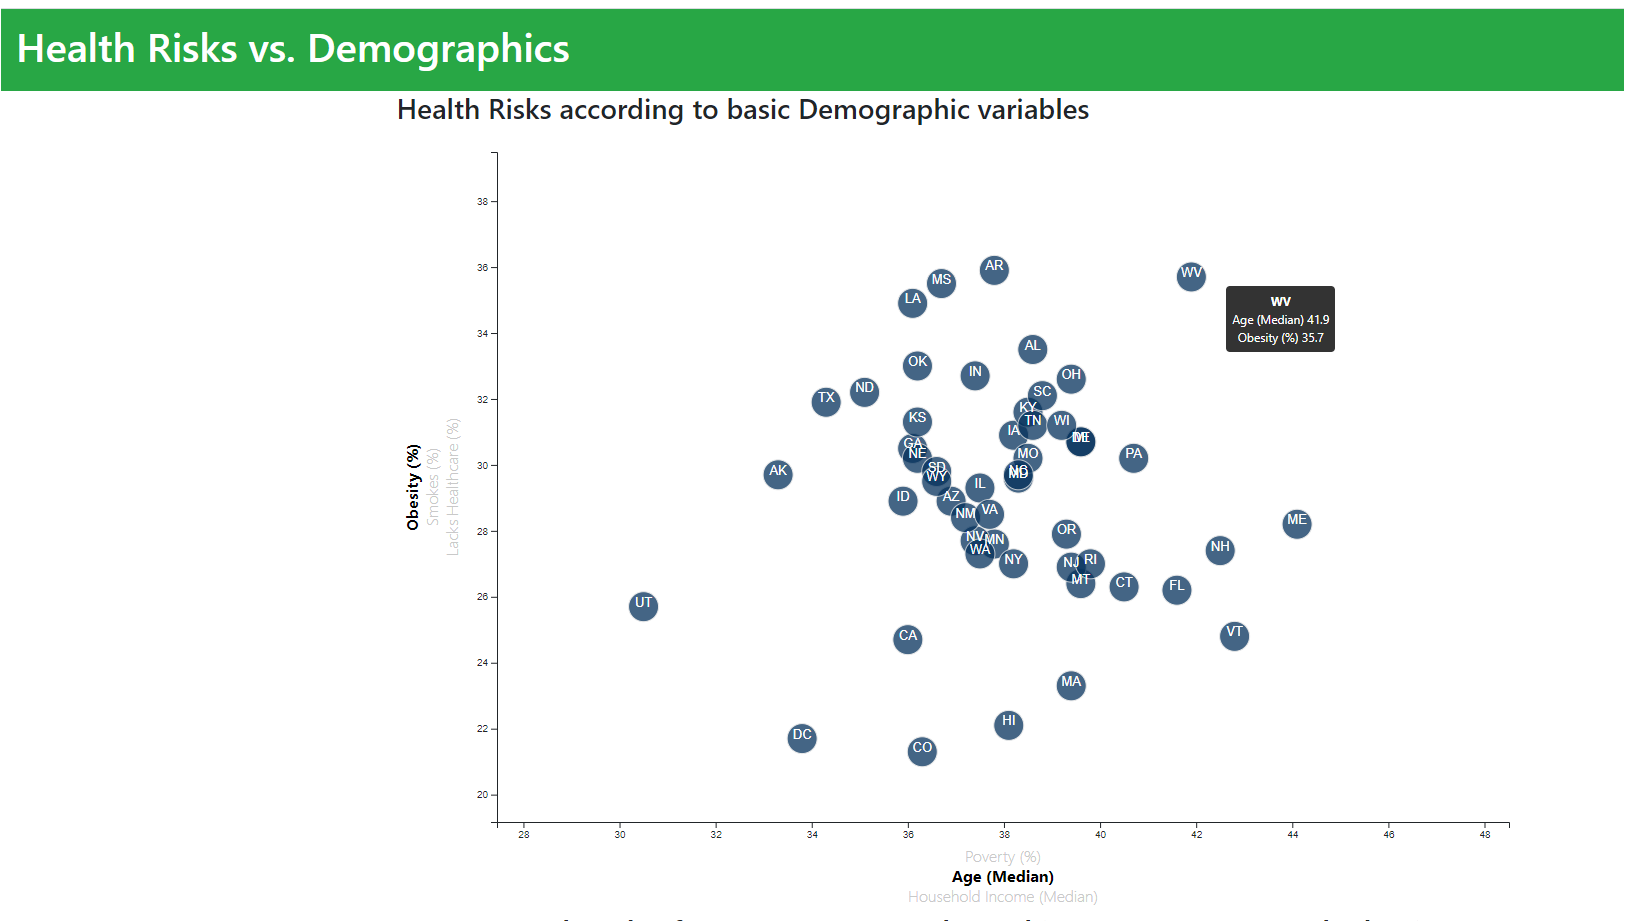
    • Added data layers for letting the ticks on the axes allow us to infer approximate values for each circle.

    • Used tooltips in my D3 graphics to reveal a specific element’s data when user hovers their cursor over the element. Added tooltips to my circles and displayed each tooltip with the data that the user has selected.

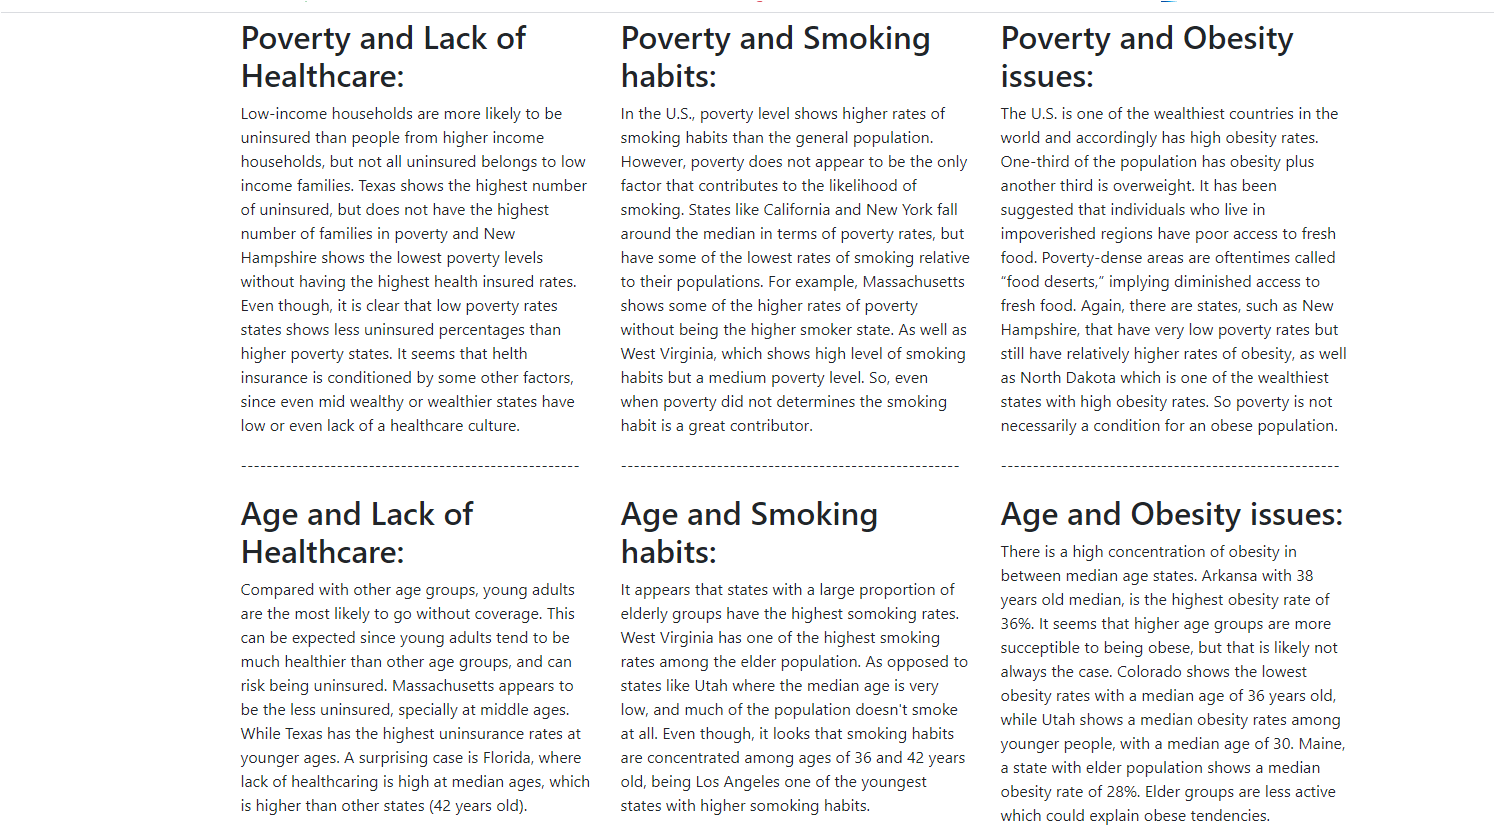
    • Completed my analysis with detailed explanations about the data behaviour

    8-tooltip

    CHALLENGE COMPLETED!!

    Sources

    Learn D3

    Updating graphs in D3

    D3 enter, update, exit

    D3 dynamic button


    Assessment Metrics

    Evaluation parameter metrics:

    • Complete all steps in the core assignment

    • Challenge myself with the Bonus task!

    • Coherency of scatter plot (labels, ticks)

    • Visual attraction

    • Professionalism

    • Create a new repository on GitHub called D3-Challenge

    GREAT CHALLENGE!


    Copyright

    © 2020 Gabriela Loami Olivares Martinez, BootCamp Tecnologico de Monterrey.
    © 2020 Trilogy Education Services, a 2U, Inc. brand. All Rights Reserved.
    Visit original content creator repository https://github.com/GabbyOlivares/D3js-Challenge
  • landing-page-bootcamp-dnc

    Landing Page Bootcamp DNC

    Sobre o Projeto

    A Landing Page Bootcamp DNC é uma página de destino desenvolvida para promover um bootcamp exclusivo oferecido pela DNC. O evento é direcionado a alunos que desejam acelerar suas carreiras em tecnologia com uma semana intensiva de aprendizado nas áreas de Back-End, Front-End e Banco de Dados.

    O design da página é inspirado na estética moderna e limpa, com foco na usabilidade e em uma experiência de usuário agradável. O layout é responsivo, garantindo que a página seja acessível e funcional em diferentes dispositivos.

    Funcionalidades

    • Cabeçalho Navegacional: Links para “Home”, “Últimas Edições” e “Requisitos para Participar”, com um botão de login.
    • Seção Principal: Apresenta o evento com um título e uma descrição atraente destacando a oportunidade de acelerar a carreira.
    • Formulário de Inscrição: Coleta informações dos usuários, incluindo nome, sobrenome, área de interesse, e-mail, telefone e uma frase criativa.
    • Rodapé: Informações sobre as escolas da DNC, informações sobre a empresa, e links para os termos de uso e política de privacidade.

    Tecnologias Utilizadas

    • HTML: Estrutura da página.
    • CSS: Estilização e responsividade.
    • Google Fonts: Fonte utilizada na página.

    Como Usar

    1. Clone o Repositório:

      git clone https://github.com/seu_usuario/landing-page-bootcamp-dnc.git
      cd landing-page-bootcamp-dnc
      
    2. Abra o Arquivo HTML:
    • Abra index.html em seu navegador para visualizar a página.

    Contribuição

    Sugestões e melhorias são bem-vindas! Se você encontrar problemas ou tiver sugestões, sinta-se à vontade para abrir uma issue ou enviar um pull request.

    Licença

    Este projeto está licenciado sob a MIT License.

    Visit original content creator repository
    https://github.com/T4RUM/landing-page-bootcamp-dnc

  • CVPRW21_GPS

    Graph-based Person Signature for Person Re-Identifications (GPS)

    This repository is the implementation of GPS for Person Re-Identifications task. Our model achieved 87.8, 78.7 on mean Average Precision (mAP) and 95.2, 88.2 on Cumulative Matching Characteristic (CMC) R-1 over Market1501 and DukeMTMC-ReID datasets, respectively. For the detail, please refer to link.

    This repository is based on and inspired by @Hao Luo’s work. We sincerely thank for their sharing of the codes.

    Summary

    The proposed framework

    Illustration of the proposed framework

    Prerequisites

    Python3

    Please install dependence package by run following command:

    pip install -r requirements.txt
    

    Datasets

    Market1501

    • The Market1501 original dataset should be downloaded via link.

    • The Market1501 attributes and body-part masks should be downloaded via link.

    • The downloaded files should be extracted to dataset/market1501/ directory.

    This directory is constructed as follow:

    |---dataset   
    |---|---market1501   
    |---|---|---bounding_box_test
    |---|---|---bounding_box_train
    |---|---|---gt_bbox
    |---|---|---gt_query
    |---|---|---query
    |---|---|---attribute
    |---|---|---Masks
    |---|---|---adj.pkl
    |---|---|---glove.pkl
    |---|---|---image_mask_path_dict.pkl
    |---|---|...
    

    DukeMTMC-ReID

    • The DukeMTMC-ReID original dataset should be downloaded via link.

    • The DukeMTMC-ReID attributes and body-part masks should be downloaded via link.

    • The downloaded file should be extracted to dataset/dukemtmc/ directory.

    This directory is constructed as follow:

    |---dataset   
    |---|---dukemtmc
    |---|---|---bounding_box_test
    |---|---|---bounding_box_train
    |---|---|---query
    |---|---|---attribute
    |---|---|---Masks
    |---|---|---adj.pkl
    |---|---|---glove.pkl
    |---|---|---image_mask_path_dict.pkl
    |---|---|...
    

    Thanks to Yutian Lin (github) for providing the Market1501 and DukeMTMC-ReID attributes.

    Training

    You should download the pretrained weight of ResNet50 model via link and put to pretrained/resnet50-pretrained/ directory.

    To train GPS model on Market1501 dataset, please follow:

    $ python train.py --config_file configs/market1501_gps_softmax_triplet_center.yml
    

    To train GPS model on DukeMTMC-ReID dataset, please follow:

    $ python train.py --config_file configs/dukemtmc_gps_softmax_triplet_center.yml
    

    The training scores will be printed every epoch.

    Testing

    In this repo, we include the pre-trained weight of GPS_market1501 and GPS_dukemtmc models.

    For GPS_market1501 pretrained model. Please download the link and move to pretrained/ directory. The trained GPS_market1501 model can be tested in Market1501 test split via:

    $ python test.py --config_file configs/market1501_gps_softmax_triplet_center.yml MODEL.PRETRAIN_CHOICE "('self')" TEST.WEIGHT "('pretrained/GPS_market1501.pth')"
    

    For GPS_dukemtmc pretrained model. Please download the link and move to pretrained. The trained GPS_dukemtmc model can be tested in DukeMTMC-ReID test split via:

    $ python test.py --config_file configs/dukemtmc_gps_softmax_triplet_center.yml MODEL.PRETRAIN_CHOICE "('self')" TEST.WEIGHT "('pretrained/GPS_dukemtmc.pth')"
    

    Citation

    If you use this code as part of any published research, we’d really appreciate it if you could cite the following paper:

    @InProceedings{Nguyen_2021_CVPR,
        author    = {Nguyen, Binh X. and Nguyen, Binh D. and Do, Tuong and Tjiputra, Erman and Tran, Quang D. and Nguyen, Anh},
        title     = {Graph-Based Person Signature for Person Re-Identifications},
        booktitle = {Proceedings of the IEEE/CVF Conference on Computer Vision and Pattern Recognition (CVPR) Workshops},
        month     = {June},
        year      = {2021},
        pages     = {3492-3501}
    }
    

    License

    MIT License

    AIOZ © 2021 All rights reserved.

    More information

    AIOZ AI Homepage: https://ai.aioz.io

    AIOZ Network: https://aioz.network

    Visit original content creator repository https://github.com/aioz-ai/CVPRW21_GPS
  • MynaBank

    Myna Bank

    Overview

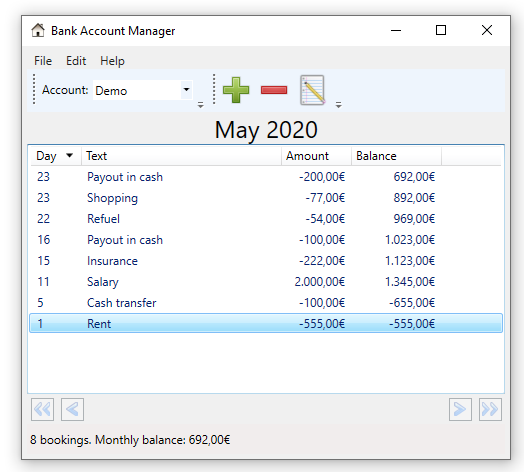
    An application to manage bank accounts.

    Myna Bank Screenshot

    Installation

    The program requires .NET 9.

    Screenshots

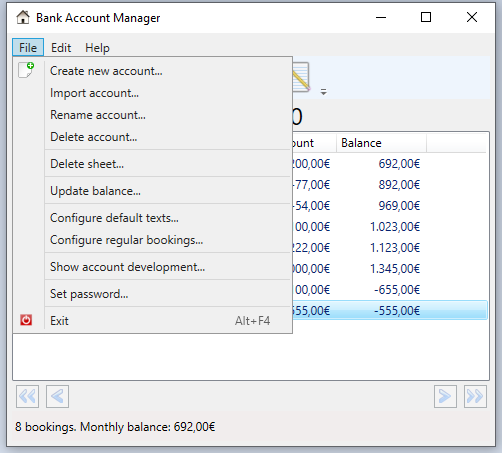
    File Menu Item

    File Menu Item Screenshot

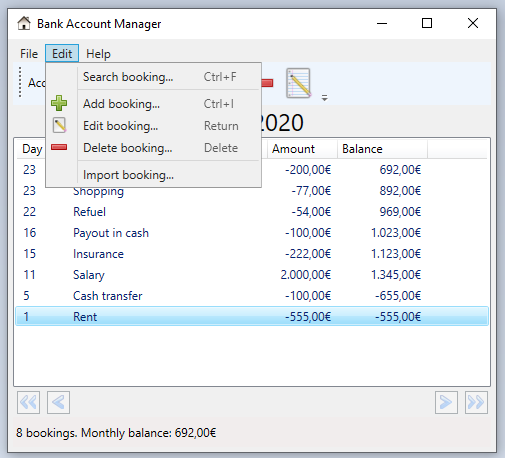
    Edit Menu Item

    Edit Menu Item Screenshot

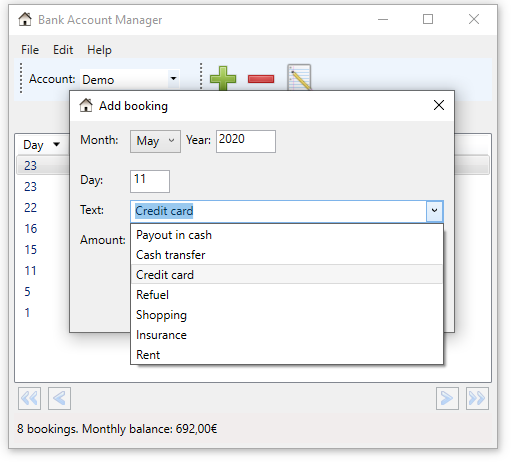
    Add Booking

    Add Menu Item Screenshot

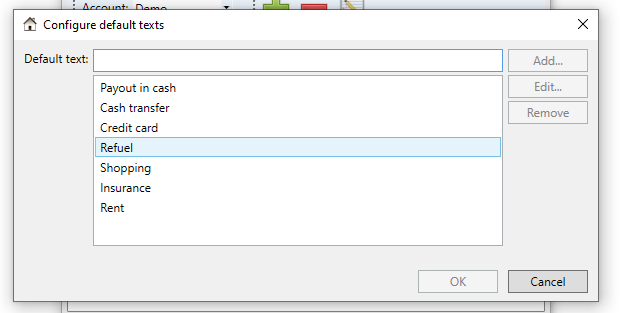
    Configure Default Texts

    Configure Default Texts Screenshot

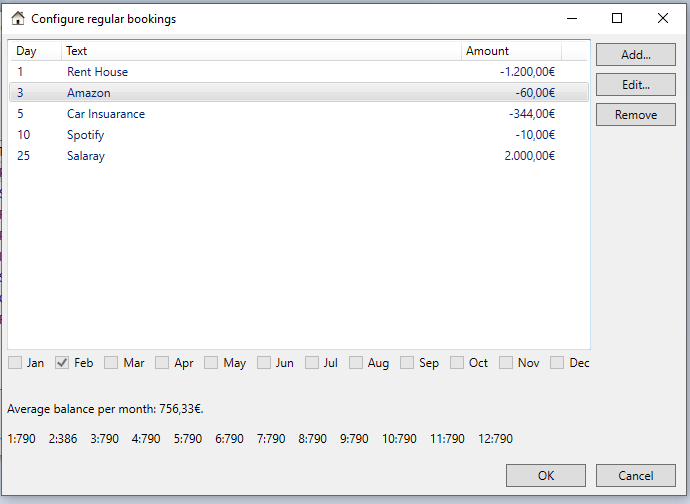
    Configure Regular Bookings

    Configure Regular Booking Screenshot

    Licenses

    The following icons are used from the Open Icon Library (https://sourceforge.net/projects/openiconlibrary):

    application-exit-5.png / nuovext2 / LGPL-2.1
    arrow-left-2.png / nuvola / LGPL-2.1
    arrow-left-double-2.png / nuvola / LGPL-2.1
    arrow-right-2.png / nuvola / LGPL-2.1
    arrow-right-double-2.png / nuvola / LGPL-2.1
    document-decrypt-3.png / oxygen / CC-BY-SA 3.0 or LGPL
    document-encrypt-3.png / oxygen / CC-BY-SA 3.0 or LGPL
    document-new-6.ico / oxygen / CC-BY-SA 3.0 or LGPL
    document-open-2.png / echo / CC-BY-SA-3.0
    document-properties-2.png / gnome / GPLv2
    document-save-7.png / nuovext2 / LGPL-2.1
    document-save-as-6.png / nuovext2 / LGPL-2.1
    edit.png / gimp / GPLv2
    edit-copy-7.png / famfamfam-silk / CC-BY-2.5 or CC-BY-3.0
    go-home-8.ico / nuovext2 / LGPL-2.1
    go-home-10.png / nuovext2 / LGPL-2.1
    homepage.png / nuvola / LGPL-2.1
    key.png / famfamfam-silk / CC-BY-2.5 or CC-BY-3.0
    kgpg_info.png / nuvola / LGPL-2.1
    list-add-4.ico / oxygen / CC-BY-SA 3.0 or LGPL
    list-remove-4.ico / oxygen / CC-BY-SA 3.0 or LGPL

    Visit original content creator repository https://github.com/nylssoft/MynaBank